


Waiting for a perfect setup—technically or fundamentally—can sometimes be a perfect way to miss an opportunity. The disruptor is market sentiment, as it jumps the gun on an opportunity hoping to be validated well after pulling the trigger.
Case in point: NVIDIA (NVDA) in March 2023. The article NVDA Stock: Waiting For a Big Plunge? warned against buying into strength, as technical indicators signaled a potential pullback while also warning that the depth of a pullback is always unpredictable.
Instead of pulling back to $230 (or $23 after its recent 10-for-1 split), it pulled back to $250 ($25) before market sentiment, again the disruptor, snatched the opportunity that later would be validated by fundamentals.
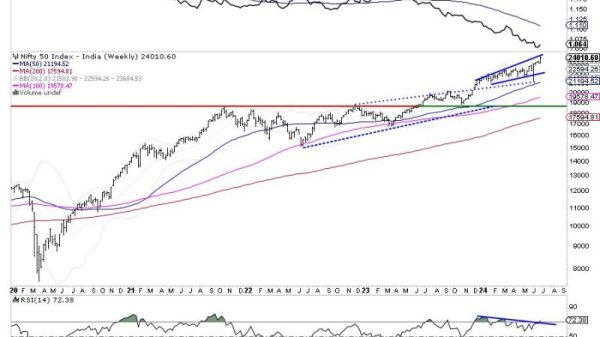
Viewing a weekly chart, here’s what happened. Take a look at the blue arrow. That was the week of the “dip.”
CHART 1. WEEKLY CHART OF NVDA. See the blue arrow? That was the buy signal last time around.Chart source: StockCharts.com. For educational purposes.
You have to squint to see the blue arrow, which seemed like a significant decision point for bulls and bears at the time. But as investor sentiment wagered on the upside, AI demand clarified that a new “era” of artificial intelligence far outweighs a short-term market opportunity. And so you see what happened.
Is NVDA a Buy Now, or Is the AI Trade Over?
NVDA share prices have fallen hard following the euphoria driven largely by the stock split. Wall Street analysts see limited upside for Nvidia in the near term and have been known to revise their targets.
In the long term, NVDA’s outlook remains positive, due to the growing importance of AI and NVDA’s dominant position in the AI hardware market. So, while short-term gains may be modest, the chipmaker is expected to outperform the market in the long run.
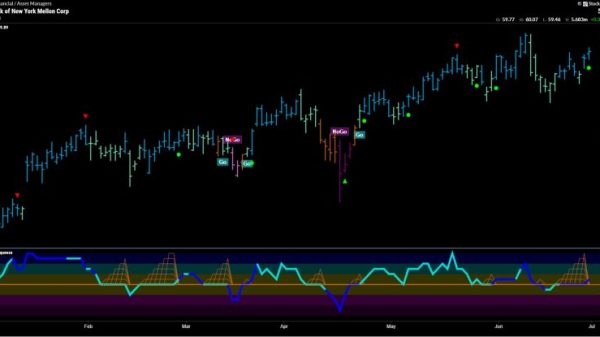
But corrections can turn into downtrends. So, if you are bullish on NVDA, here are the levels to watch. Take a look at NVDA’s daily chart below.
CHART 2. DAILY CHART OF NVDA. NVDA shares are falling. But will the decline remain a dip, or might it cascade into a much stronger downtrend?Chart source: StockCharts.com. For educational purposes.
While the Chaikin Money Flow (CMF) indicates that buying pressure remains positive, it also shows bullish momentum in a steep decline. The Money Flow Index (MFI), a volume-weighted RSI, confirms this reading, showing prices declining from overbought levels alongside a bearish divergence between the indicator and NVDA.
The chart plots an Ichimoku Cloud (kumo) to map out a wider context to anticipate potential support. Here’s what to keep an eye on:
The cloud coincides with the 50% and 61.8% Fibonacci Retracement levels, which generally serve as favorable buying levels if you want to go long.
The 50-day simple moving average (SMA), also commonly viewed as a potential support level, is also looking to converge with the 50% Fib level.
The 50% and 61.8% Fib levels, along with the top and bottom end of the cloud, also match the two Runaway Gaps, which, if filled, tend to serve as support levels.
In short, the actionable buying range sits between $105-ish and $110. Of course, ultra-bullish market sentiment can disrupt this setup (as it did in March 2023) and send NVDA prices higher and sooner.
On the bearish side, if NVDA falls below $100, there’s a possibility the correction will become an intermediate-term downtrend. What can trigger this scenario? Unimpressive earnings in the next few quarters (its next earnings is in August).
The Takeaway
While NVDA’s long-term outlook remains bright thanks to its stronghold in the AI hardware market, expect near-term weakness. The key levels to watch for potential support are around $105 to $110, with ultra-bullish sentiment potentially pushing prices up sooner. However, if NVDA drops below $100, we could see a longer downtrend, especially if upcoming earnings disappoint. So, keep an eye on those levels and market sentiment to time your moves wisely.
Disclaimer: This blog is for educational purposes only and should not be construed as financial advice. The ideas and strategies should never be used without first assessing your own personal and financial situation, or without consulting a financial professional.